Advanced Image Processing
Basic Relationships Between Pixels
- Neighborhood
- Adjacency
- Paths
- Connectivity
- Regions
- Boundaries
Neighbors of a pixel – N4(p)
- Any pixel p(x, y) has two vertical and two horizontal neighbors, given by
(x+1, y),
(x-1, y),
(x, y+1),
(x, y-1)
- This set of pixels are called the 4-neighbors of P, and is denoted by N4(P).
| x , y+1 | ||
| x-1 , y | x,y | x+1 , y |
| x , y-1 |
Neighbors of a pixel – ND(p)
- Any pixel p(x, y) has four diagonal neighbors, given by
(x+1, y+1), (x+1, y-1), (x-1, y+1), (x-1 ,y-1)
- This set is denoted by ND(p).
| x-1 , y+1 | x+1, y+1 | |
| x,y | ||
| x-1, y-1 | x+1,y-1 |
Neighbors of a pixel – N8(p)
- ND(p) and N4(p) are together known as 8-Neighbors and are denoted by N8(p)
- ND(p) U N4(p) = N8(p)
- What about when p(x,y) is a border pixel of the image ?
| x-1,y+1 | x,y+1 | x+1,y+1 |
| x-1,y | x,y | x+1,y |
| x-1,y-1 | x,y-1 | x+1, y-1 |
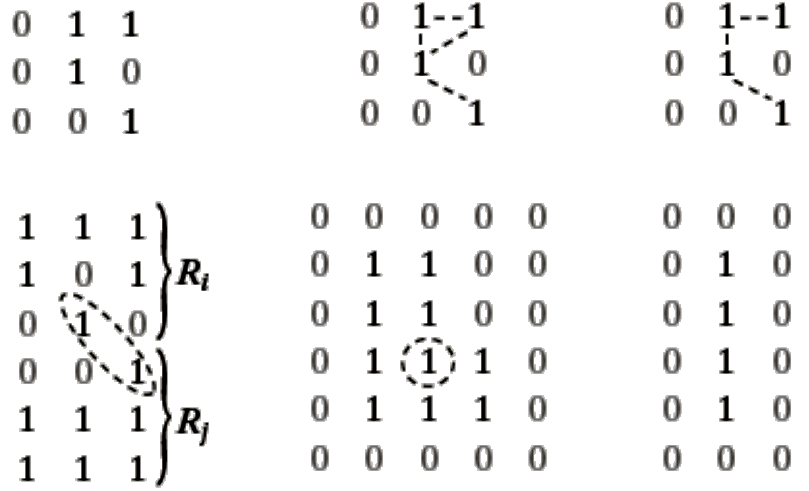
Adjacency
- Let V be the set of intensity values used to define adjacency
- For binary images à V = {1}
- A particular grayscale image à V = {1,3,5,…,251,253,255}
- 4-adjacency: Two pixels p and q with values from V are 4-adjacent if q is in the set N4(p).
- 8-adjacency: Two pixels p and q with values from V are 8-adjacent if q is in the set N8(p).
- m-adjacency: Two pixels p and q with values from V are m-adjacent if,
q is in N4(p)
OR
q is in ND(p) AND N4(p)∩N4(q) has no pixels whose values are from V
Path
- set of pixels lying in some adjacency definition
- 4-adjacency à 4-path
- 8-adjacency à 8-path
- m-adjacency à m-path
- path length ?
- Number of pixels involved
Connectivity
- Let Sà subset of pixels in an image
- Two pixels p and q are said to be connected in S if there exist a path between them consisting entirely of pixels in S.
- For any pixel p in S the set of pixels that are connected to it in S is called connected component of S.
- If S has only one connected component, then it is called connected set.
Region
- A connected set is also called a Region.
- Two regions (let Ri and Rj) are said to be adjacent if their union forms a connected set. Adjacent Regions or joint regions
- Regions that are not adjacent are said to be disjoint regions.
- 4- and 8-adjacency is considered when referring to regions (author)
- Discussing a particular region, type of adjacency must be specified.
- Fig2.25d the two regions are adjacent only if 8-adjacency is considered
Foreground and Background
- Suppose an image contain K disjoint regions Rk , k=1,2,3,…K, none of which touches the image border
- Let Ru denote the union of all the K regions.
- Let (Ru)c denote its compliment.
- We call all the points in Ru the foreground and all the points in (Ru)c the background
Boundary
- The boundary (border or contour) of a region R is the set of points that are adjacent to the points in the complement of R.
- Set of pixels in the region that have at least one background neighbor.
- The boundary of the region R is the set of pixels in the region that have one or more neighbors that are not in R.
- Inner Border: Border of Foreground
- Outer Border: Border of Background
- If R happens to be entire Image?
- There is a difference between boundary and edge in Digital Image Paradigm. The author refers this discussion to chapter 10.
Distance Measures
- Euclidean Distance: De(p, q) = [(x-s)2 + (y-t)2]1/2
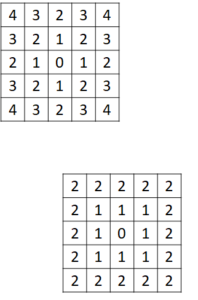
- City Block Distance: D4(p, q) = |x-s| + |y-t|
- Chess Board Distance: D8(p, q) = max(|x-s|, |y-t|)
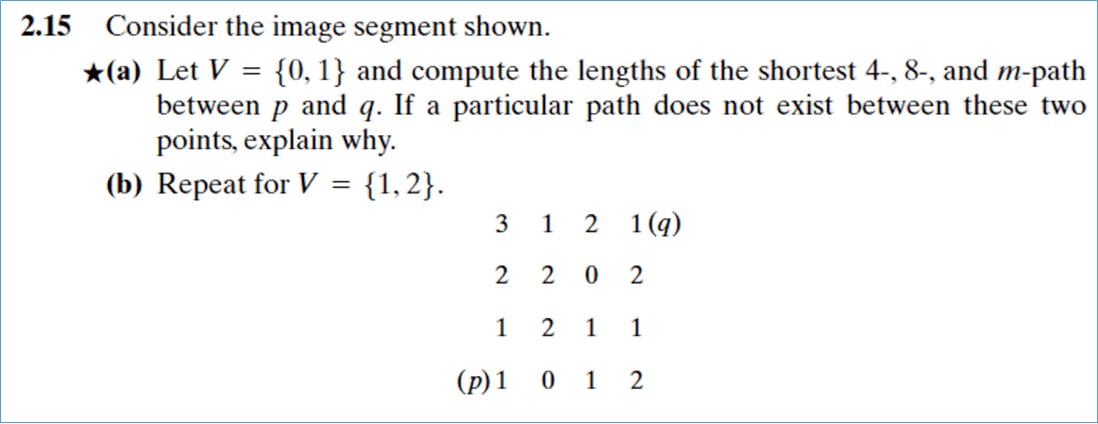
Sample Problem from exercise
Histogram Representation
- Histograms plots how many times (frequency) each intensity value in image occurs
- Image below (left) has 256 distinct gray levels (8 bits)
- Histogram (right) shows frequency (how many times) each gray level occurs
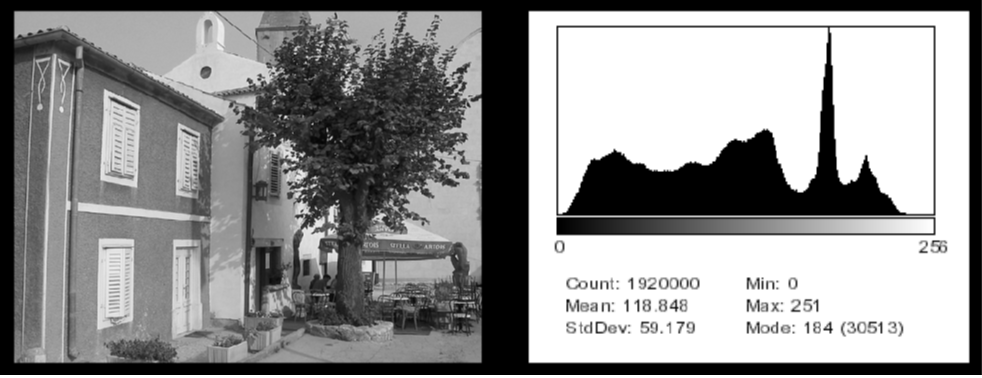
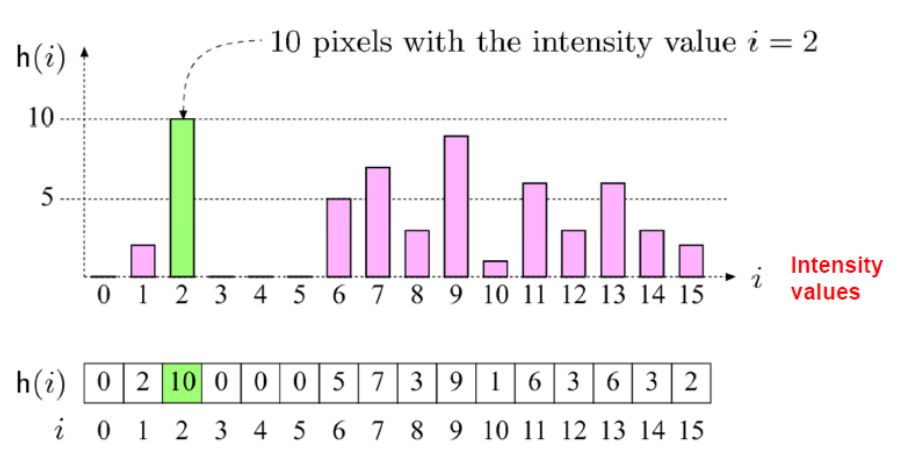
- E.g. K = 16, 10 pixels have intensity value = 2
- Only statistical information
- No indication of location of pixels
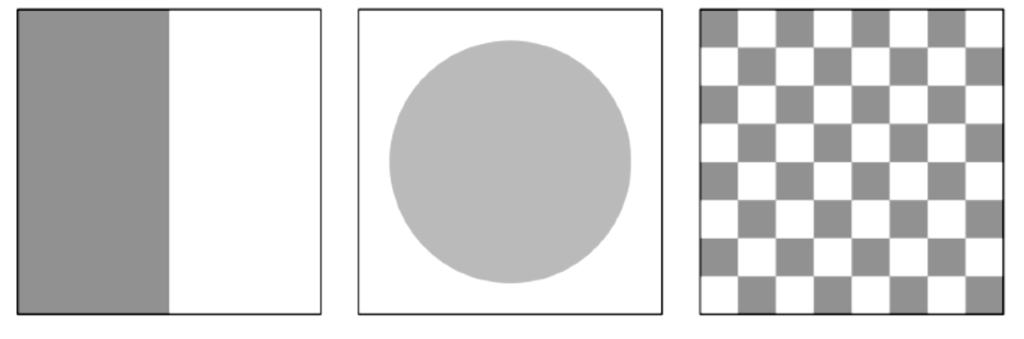
Rough guess about the histogram of these images ?
Histogram Representation
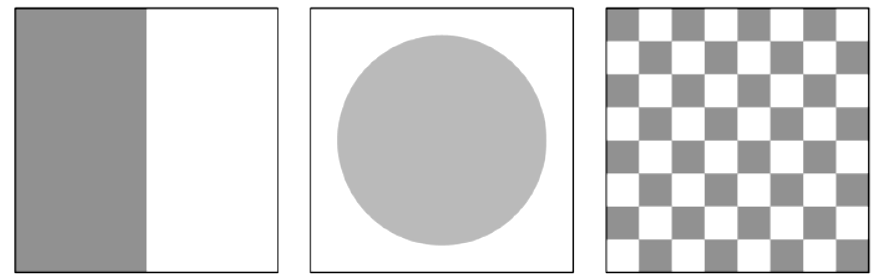
- Different images can have same histogram
- 3 images below have same histogram
- Half of pixels are gray, half are white
- Same histogram = Same statistics
- Distribution of intensities could be different
Histogram Representation
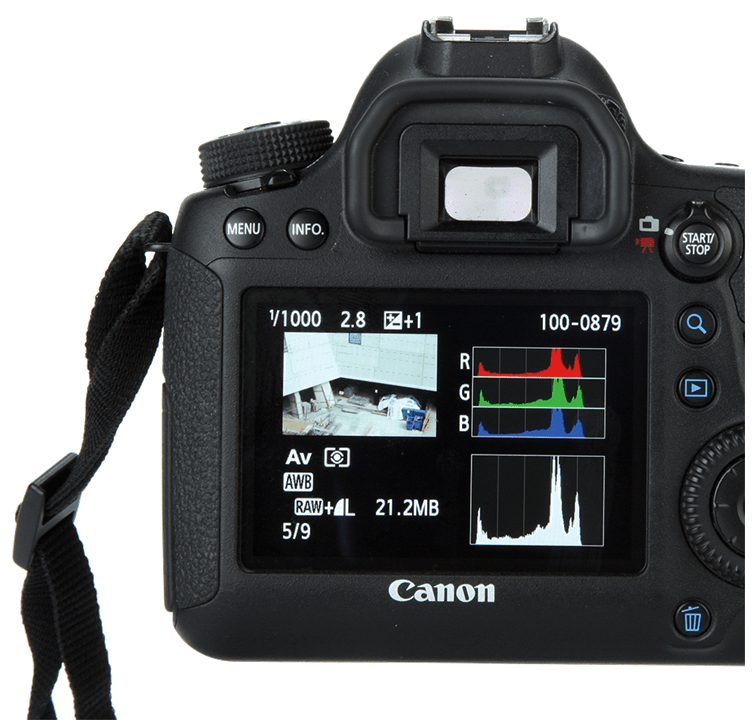
- Many cameras display real time histograms of scene
- Helps taking pictures according to your requirement
- Also easier to detect types of processing applied to image
?
- Can we reconstruct image from histogram ?
Histogram
- Histograms help detect image acquisition issues
- Histogram representation of an image can be useful in following characteristics of an image.
- Exposure: amount of light per unit area reaching the image sensor
- Brightness: average intensity of all pixels in image
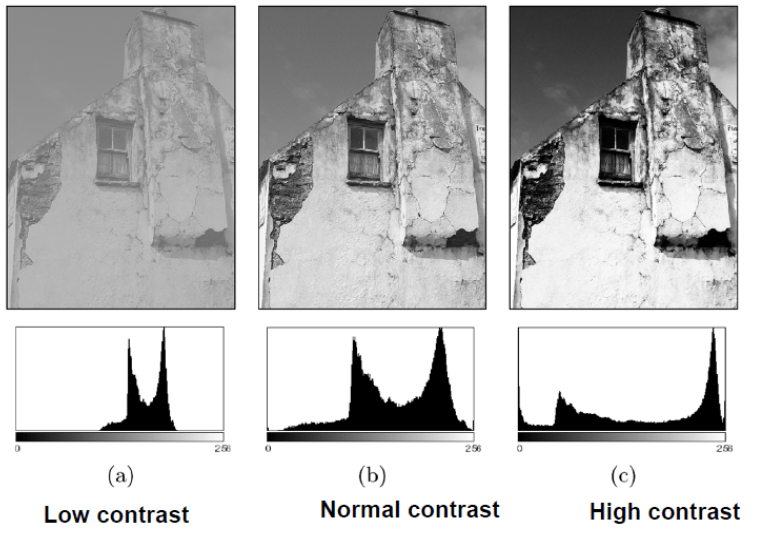
- Contrast: difference of foreground and background (objects distinction)
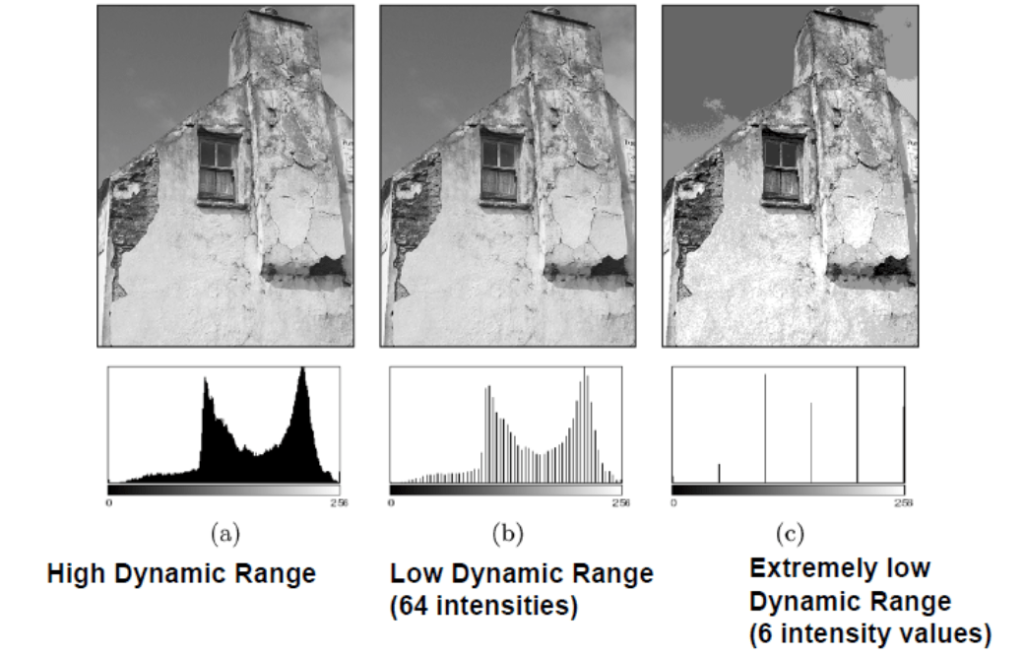
- Dynamic Range: Number of distinct pixels in image
- Artifacts: Image alteration after it is being captured
Histogram Representation
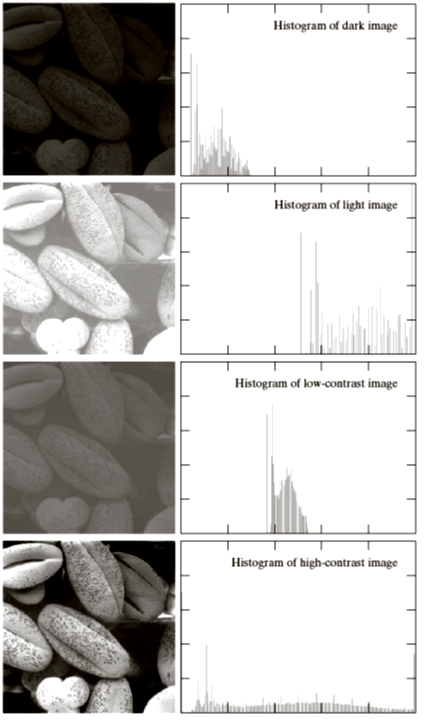
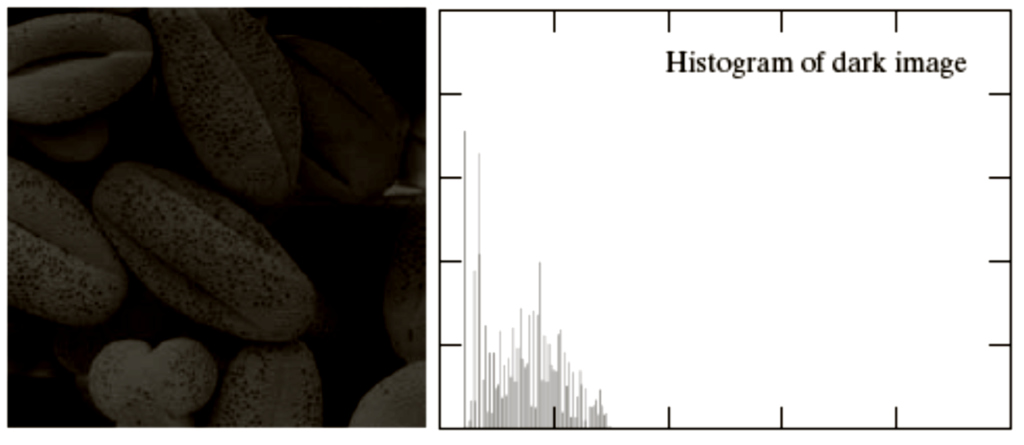
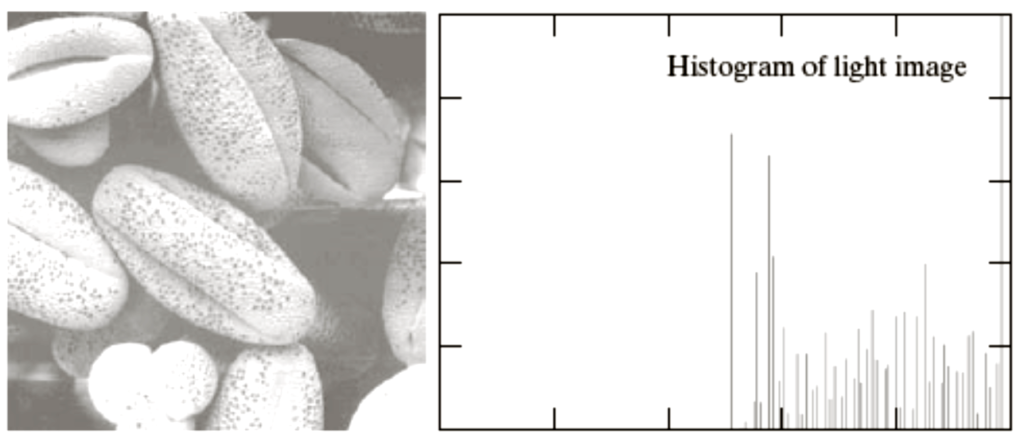
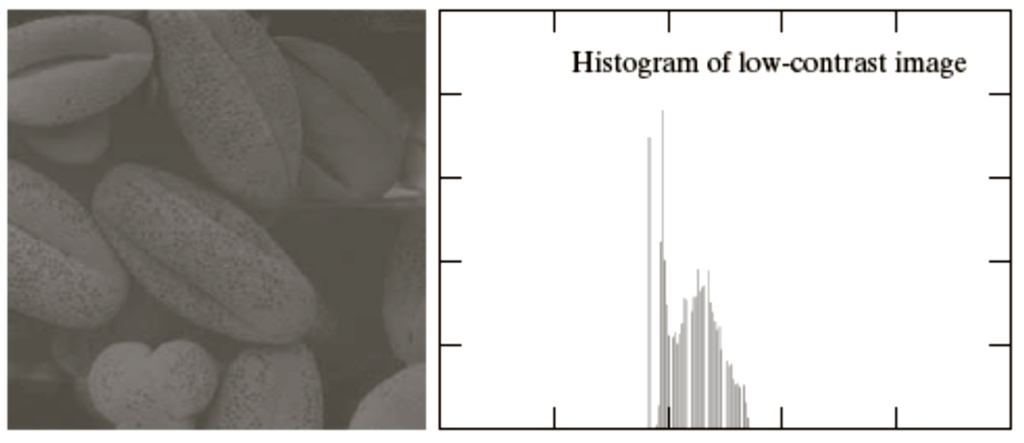
Four basic image types: dark, light, low contrast, high contrast and their corresponding histograms.
Histogram Representation
Histogram Representation
Histogram Representation
Histogram Representation
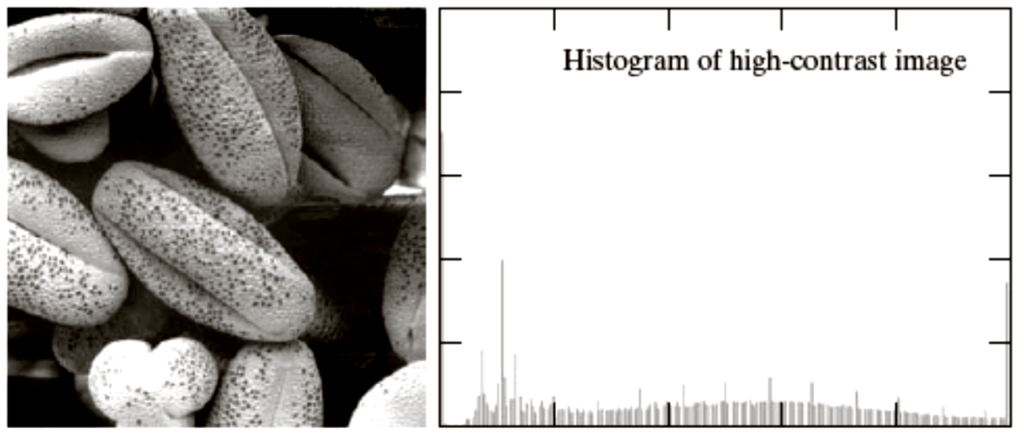
Contrast
- Good Contrast?
- Widely spread intensity values
- Large difference between min and max intensity values
Related links